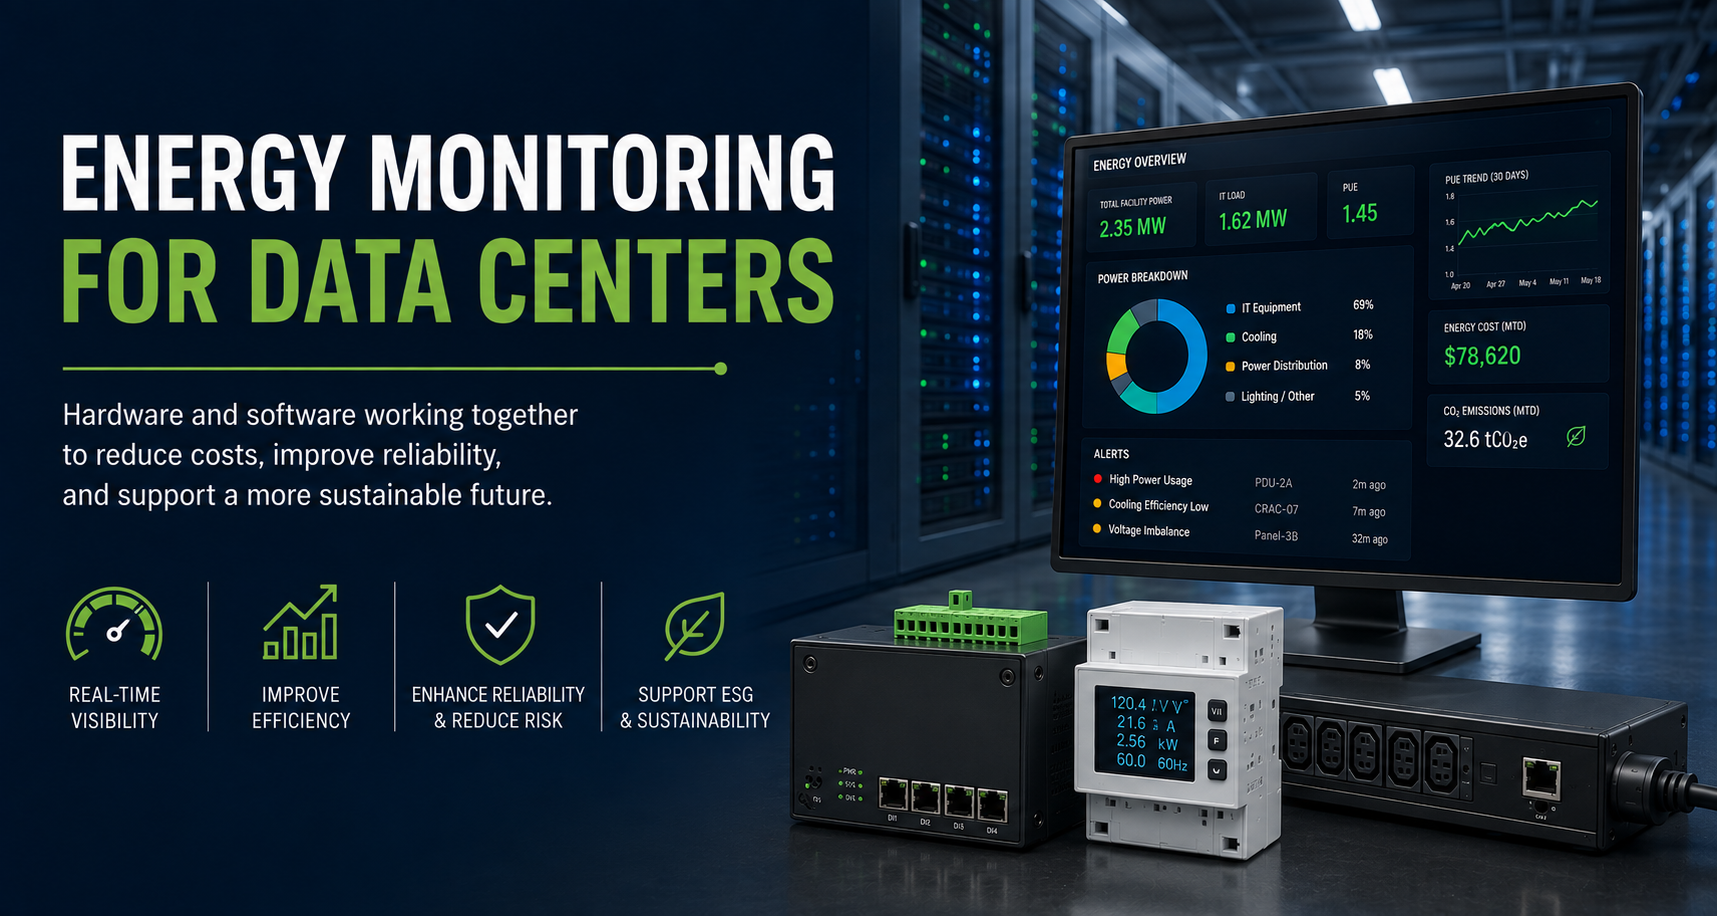
Data centers have always depended on power, cooling, and environmental control, but the scale of that dependency is changing rapidly. Artificial intelligence, high-performance computing, cloud services, edge computing, and increasing digitalization are driving unprecedented demand for data center capacity. According to the U.S. Department of Energy, data centers consumed approximately 176 terawatt-hours (TWh), or 4.4% of total U.S. electricity, in 2023. By 2028, that figure could rise to between 325 and 580 TWh—approximately 6.7% to 12% of U.S. electricity consumption (U.S. Department of Energy, 2024).
For operators, this makes energy management more than an environmental initiative. It is becoming a fundamental requirement for controlling operating costs, maintaining capacity, protecting equipment, supporting uptime, and planning future growth.
Energy monitoring provides the visibility necessary to understand where energy is being consumed, identify abnormal conditions, measure performance, establish baselines, and make informed operational decisions. For critical-infrastructure organizations, these capabilities become especially important because energy consumption, environmental conditions, equipment health, and service availability are often closely interconnected.
For IMCI Technologies' customers—including organizations responsible for telecommunications, utilities, data centers, public safety, and other distributed critical infrastructure—the objective is not simply to consume less power. It is to make energy use measurable, manageable, and operationally meaningful.
From Basic Metering to Intelligent Energy Management
Historically, energy and facility data were often managed through separate systems. Electrical meters monitored consumption, building management systems controlled HVAC equipment, network management systems monitored IT infrastructure, and operators manually correlated information when problems occurred.
Modern infrastructure management increasingly brings these previously isolated functions together. Data Center Infrastructure Management (DCIM) and related energy-management platforms have evolved around the idea that electrical, mechanical, environmental, and IT performance should be analyzed as interconnected systems rather than separate operational domains.
This evolution is particularly important because efficiency is rarely the result of a single piece of equipment. Server utilization affects IT load; IT load affects heat generation; heat generation affects cooling requirements; cooling affects facility energy consumption; and electrical conversion and distribution introduce additional losses.
Modern energy monitoring software therefore collects data across the facility and converts it into actionable information that can be analyzed over minutes, hours, days, seasons, and years.
Industry standards increasingly reinforce this approach. ANSI/ASHRAE Standard 90.4-2025, Energy Standard for Data Centers, establishes minimum energy-efficiency requirements for the design, construction, and planned operation and maintenance of data centers while considering energy consumption, water use, renewable energy, and greenhouse-gas emissions (ASHRAE, 2025).
Internationally, ISO 50001:2018 provides a structured Energy Management System framework designed around continual improvement in energy performance, while the recently published ISO/IEC 30134-2:2026 standard defines consistent methods for calculating, measuring, and reporting Power Usage Effectiveness (PUE) (International Organization for Standardization, 2018, 2026).
Regulatory expectations are also increasing. In the European Union, operators of data centers with an installed IT power demand of at least 500 kW are subject to sustainability information and KPI reporting requirements under the EU's data-center reporting framework (European Commission, 2024).
Together, these developments are pushing data center operations toward more continuous, measurable, and standards-based energy management.
Core Components of Energy Monitoring Software
Effective Energy Monitoring requires more than installing a utility meter. A comprehensive system typically incorporates several layers of information.
1. Electrical Power Monitoring
The foundation is measurement of electrical consumption throughout the power chain—from utility service and switchgear to UPS systems, generators, power distribution units, branch circuits, racks, and individual loads where appropriate.
Important parameters may include:
- Voltage and current
- Real and apparent power
- Power factor
- Energy consumption in kWh
- Frequency
- Peak demand
- UPS loading and efficiency
- Generator operating status
- Power-quality conditions
Granular monitoring allows operators to determine not simply how much electricity a facility consumes, but where that electricity is being used.
2. Environmental Monitoring
Energy use cannot be separated from environmental conditions. Temperature, humidity, airflow, differential pressure, and cooling-system operating data can reveal inefficient cooling strategies, airflow problems, hot spots, or unnecessarily conservative temperature settings.
ASHRAE's AI Data Center Energy Performance Framework specifically emphasizes integrated energy and thermal management, real-time monitoring, intelligent controls, and continuous commissioning as increasingly important capabilities for high-density computing environments (ASHRAE, n.d.).
3. Data Aggregation and Normalization
Data centers frequently contain equipment from many manufacturers and generations. An effective monitoring architecture must therefore collect information from heterogeneous sources and translate it into a common operational view.
This becomes particularly important in existing facilities, where replacing functioning equipment simply to achieve software compatibility may be economically impractical.
4. Analytics, Trending, and Visualization
Individual readings provide limited value without context. Energy monitoring software should preserve historical information so operators can compare consumption against previous periods, operating conditions, workloads, weather patterns, utility rates, and established baselines.
Dashboards should enable users to move from an enterprise-level view to individual facilities, systems, and devices, helping determine whether an unusual energy condition represents normal variation or an emerging operational problem.
5. Alarm and Exception Management
A monitoring system should identify conditions requiring attention rather than requiring personnel to continuously watch dashboards.
Thresholds, rate-of-change alarms, equipment faults, communication failures, temperature excursions, demand peaks, and abnormal energy consumption can generate notifications that direct personnel toward conditions requiring investigation.
6. Key Performance Indicators
One of the best-known data center metrics is Power Usage Effectiveness (PUE), which compares total facility energy with the energy delivered to IT equipment. ISO/IEC 30134-2:2026 formalizes the measurement and reporting methodology so PUE can be calculated consistently (International Organization for Standardization, 2026).
PUE should not be treated as the only measure of performance. Depending on operational objectives, organizations may also track energy cost, peak demand, carbon intensity, water consumption, cooling efficiency, renewable-energy contribution, equipment utilization, and facility-specific KPIs.
Benefits of Effective Energy Monitoring
The most obvious benefit is reduced operating cost. Organizations cannot systematically optimize consumption they cannot accurately measure.
The benefits extend well beyond the electric bill.
Continuous monitoring can reveal cooling systems operating unnecessarily, lightly loaded UPS equipment, abnormal power conditions, stranded capacity, inefficient operating schedules, deteriorating equipment performance, or consumption patterns that differ from expected baselines.
Energy data can also improve capacity planning. Instead of relying only on nameplate ratings or theoretical capacity, operators can use actual operating data to understand electrical and thermal headroom.
Monitoring also contributes to reliability and resilience. Energy anomalies can sometimes be early indicators of equipment deterioration or changing operating conditions. Combining power, environmental, facility, and network information provides operations personnel with a more complete picture of infrastructure health.
Challenges to Implementation
The primary obstacle is often not the software itself—it is the underlying data environment.
Existing facilities can contain decades of equipment using different protocols, interfaces, data formats, naming conventions, and communications architectures. Some devices expose detailed telemetry through network protocols; others may provide only serial communications, analog values, or contact closures.
Data quality presents another challenge. Incorrect meter scaling, poorly placed sensors, inconsistent timestamps, missing information, and uncalibrated instrumentation can produce misleading conclusions.
Organizations must also avoid collecting data simply because it is available. Thousands of measurements without clearly defined operational objectives can create information overload rather than insight.
Finally, cybersecurity must be incorporated into the architecture from the beginning. Infrastructure monitoring increasingly connects operational technology, facility equipment, sensors, meters, networks, and enterprise applications. Access control, encrypted communications, system segmentation, authentication, logging, and controlled integration should therefore be considered fundamental design requirements.
Best Practices for Implementation
A practical energy-monitoring program can be built incrementally.
1. Establish the business objective. Determine whether the primary goals are reducing utility expense, improving PUE, increasing capacity, identifying equipment problems, supporting sustainability reporting, managing distributed sites, or some combination of these objectives.
2. Establish an energy baseline. Capture enough historical information to understand normal facility behavior across workload, weather, time-of-day, and seasonal conditions.
3. Map the infrastructure. Identify utility feeds, generators, switchgear, UPS systems, PDUs, cooling equipment, environmental sensors, IT loads, and existing monitoring interfaces.
4. Determine appropriate measurement points. Begin at the facility level and progressively add detail where additional information can support an operational decision.
5. Integrate existing equipment whenever practical. A vendor-neutral architecture can reduce the need to replace functioning meters, sensors, controllers, or facility equipment solely for monitoring purposes.
6. Normalize and contextualize the data. Raw measurements should be associated with facilities, equipment, operating conditions, and meaningful KPIs.
7. Configure actionable thresholds and alarms. Alerts should identify conditions that require investigation without creating unnecessary alarm volume.
8. Build role-appropriate dashboards. Executives may need cost, capacity, risk, and performance trends; facility personnel may need electrical and thermal information; technicians may need device-level diagnostics.
9. Review performance regularly. Energy management should become a continual-improvement process rather than a one-time engineering exercise. This approach is consistent with the systematic management model established by ISO 50001 (International Organization for Standardization, 2018).
10. Expand analytics once reliable data exists. Forecasting, anomaly detection, predictive maintenance, machine learning, and automated optimization all become considerably more valuable when built upon high-quality historical operational data.
Real-World Results
The potential value of detailed monitoring is well established.
At a U.S. Department of Agriculture Tier 3 National Information Technology Center data center, wireless sensors were used to collect temperature, humidity, power, and pressure information. Researchers analyzed the resulting data with specialized software and identified energy-efficiency opportunities. After recommended improvements were implemented, the facility achieved a 48% reduction in cooling load, a 17% reduction in facility power usage, and an improvement in PUE from 1.83 to 1.51 (U.S. General Services Administration, 2016).
Another widely cited example comes from Google. Google DeepMind reported that machine-learning analysis of data-center operating information enabled a 40% reduction in energy used for cooling and approximately a 15% reduction in overall PUE overhead at the facility involved (Evans & Gao, 2016).
These examples illustrate an important principle: sophisticated optimization begins with visibility. Sensors and meters generate measurements; monitoring systems organize those measurements; analytics identify relationships; and operations teams convert those insights into action.
The Future: AI, High-Density Computing, and Intelligent Operations
The need for energy monitoring is likely to increase rather than diminish.
AI workloads are dramatically increasing rack power density and changing cooling architectures. ASHRAE's current guidance discusses AI environments exceeding 50–100 kW per rack, along with growing adoption of direct-to-chip liquid cooling, heat recovery, advanced controls, real-time monitoring, and digital twins (ASHRAE, n.d.).
At the same time, energy management is moving from descriptive analytics—what happened—to predictive and prescriptive analytics—what is likely to happen and what should be done about it.
Future systems will increasingly correlate electrical consumption, cooling performance, environmental conditions, IT utilization, equipment condition, weather, utility pricing, and historical behavior. Digital twins and machine-learning models may enable operators to test operational changes virtually before applying them to physical infrastructure.
The result is a transition from traditional monitoring toward continuous infrastructure optimization.
How IMCI Technologies Supports Energy Monitoring
IMCI Technologies provides an architecture particularly suited to heterogeneous and distributed critical infrastructure.
IMCI's Open-i® Q-Series infrastructure managers, including the Open-i Q1000, are designed to collect information from facility equipment, network devices, power and energy meters, and environmental sensors from multiple manufacturers. The platform supports remote monitoring, configuration, control, and management while translating device-level information for use across a networked management environment. IMCI identifies large data centers among the applications suited to the Q1000 platform (IMCI Technologies, n.d.-c).
At the enterprise level, IRiS™ Infrastructure Monitoring & Management Software provides a web-based platform for collecting, organizing, displaying, reporting, and distributing event and performance information from Open-i devices and third-party infrastructure. Its published capabilities include power monitoring and energy management, environmental monitoring, integrated building management, performance monitoring, advanced reporting, real-time notifications, role-based access control, and encryption of data in transit and at rest (IMCI Technologies, n.d.-b).
IMCI's energy analytics capabilities extend this information into historical analysis, dashboards, reporting, baseline comparison, forecasting, and KPI trending. IMCI also supports correlation with information such as weather conditions, utility rates, energy consumption, and building operations data (IMCI Technologies, n.d.-a).
This vendor-neutral, edge-to-enterprise approach can be especially valuable for organizations operating mixed-generation infrastructure or geographically distributed sites. Rather than treating power, environmental conditions, facility equipment, and network status as independent information silos, the objective is to create a unified operational picture.
Turning Energy Data Into Operational Intelligence
Energy monitoring software is no longer simply a tool for measuring electricity consumption. It is becoming an essential part of data center capacity management, reliability, sustainability, operational intelligence, and financial control.
As power requirements rise and infrastructure becomes more complex, organizations will need increasingly granular visibility into where energy is being consumed, why consumption is changing, and what actions can improve performance without compromising availability.
The organizations positioned to benefit most will be those that establish reliable data collection today and progressively transform that information into analytics, forecasting, and intelligent control.
For critical-infrastructure operators, the objective is straightforward: measure what is happening, understand why it is happening, and give operations teams the information they need to act.
Learn More
IMCI Technologies can help organizations integrate power, environmental, facility, and infrastructure monitoring into a centralized management environment designed for critical operations.
Contact IMCI Technologies to schedule a consultation or demonstration and explore how Open-i®, IRiS™, and IMCI's energy analytics capabilities can provide greater visibility into the efficiency, capacity, and operational health of your infrastructure.
References
ASHRAE. (2025). Energy standard for data centers (ANSI/ASHRAE Standard 90.4-2025). https://www.ashrae.org/technical-resources/standards-and-guidelines/titles-purposes-and-scopes
ASHRAE. (n.d.). Energy and thermal efficiency: AI data center energy performance framework. Retrieved August 14, 2026, from https://www.ashrae.org/technical-resources/ai-data-center-framework/energy-and-thermal-efficiency
European Commission. (2024). Commission Delegated Regulation (EU) 2024/1364 of 14 March 2024 on the first phase of the establishment of a common Union rating scheme for data centres. Official Journal of the European Union. https://eur-lex.europa.eu/legal-content/EN/TXT/PDF/?uri=OJ:L_202401364
Evans, R., & Gao, J. (2016, July 20). DeepMind AI reduces Google data centre cooling bill by 40%. Google DeepMind. https://deepmind.google/blog/deepmind-ai-reduces-google-data-centre-cooling-bill-by-40/
IMCI Technologies. (n.d.-a). Data analytics and business intelligence. Retrieved August 14, 2026, from https://www.imci.net/data-business
IMCI Technologies. (n.d.-b). IRiS™ infrastructure monitoring & management software. Retrieved August 14, 2026, from https://www.imci.net/remote-infrastructure-management-software
IMCI Technologies. (n.d.-c). Open-i Q1000. Retrieved August 14, 2026, from https://www.imci.net/products/open-i-q1000
International Organization for Standardization. (2018). Energy management systems—Requirements with guidance for use (ISO Standard No. 50001:2018). https://www.iso.org/standard/69426.html
International Organization for Standardization. (2026). Information technology—Data centres key performance indicators—Part 2: Power usage effectiveness (PUE) (ISO/IEC Standard No. 30134-2:2026). https://www.iso.org/standard/30134-2
U.S. Department of Energy. (2024, December 20). DOE releases new report evaluating increase in electricity demand from data centers. https://www.energy.gov/articles/doe-releases-new-report-evaluating-increase-electricity-demand-data-centers
U.S. General Services Administration. (2016). Evidence-based best practices around data center management: Lessons learned from the public and private sectors. https://datacenters.lbl.gov/sites/default/files/DCOI_BestPractices92016.pdf